
Analytics
Get quick stats without ever leaving Cascade.
Analytics can provide you with insight into information like how many people are visiting a page, how long they are staying, whether they are engaging with the page, where they came from, where they visit next, and so much more — sometimes it's more information than you want or need. Luckily, Cascade provides simple, inline analytics that give you quick access to the stats that many of our editors find most valuable.
 To view a page or folder's analytics:
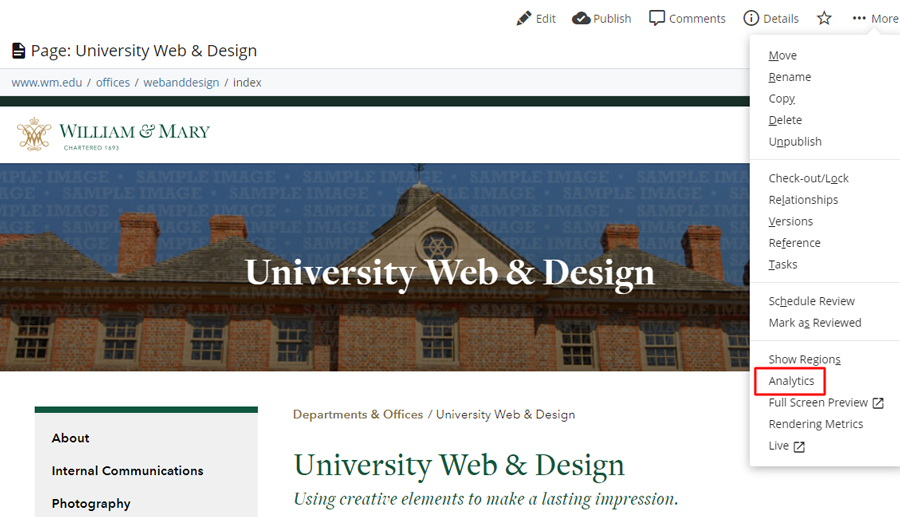
- Select the folder or page
- Select the More menu
- Select Analytics
You can toggle date ranges to review the data for the past day, week, month or year.
Don't see your Analytics in Cascade?
In 2023, the Cascade Analytics feature transitioned to use a new data source — Google Analytics 4 (GA4). If you do not see data when you select the Analytics feature for your pages or if you have questions about your GA4 data, please contact your Cascade Manager.
Available Metrics for Pages
When the Analytics window is viewed for a non-index page, the metrics provided include:
-
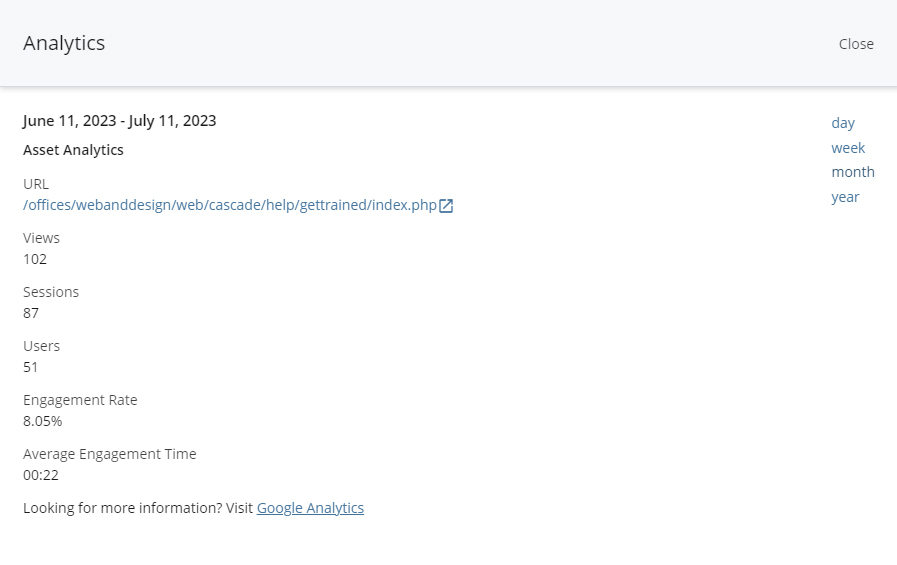 Views: The total number of times a user viewed a page. Repeated views of a single page are counted.
 - Sessions: A session is a period of time during which a user interacts with our websites. A session times out after 30 minutes of inactivity.
- (Active) Users: The total number of active users who visited the page. An active user is a new user or a user with an engaged session*.
- Engagement Rate: The percentage of sessions that were engaged sessions*.
- Average Engagement Time: The average length of time that the page had focus in a visitor's browser.
*An engaged session is one that lasted ten or more seconds, triggered a pre-defined conversion event or included multiple page visits across our sites.
Where is my index page data?
Data for index pages are available on the index page's folder — this aligns with the simplified web addresses used for index pages. For example, the live web address for the www.wm.edu > about > index page is www.wm.edu/about/, thus capturing the analytics data on the folder.
Available Metrics for Folders
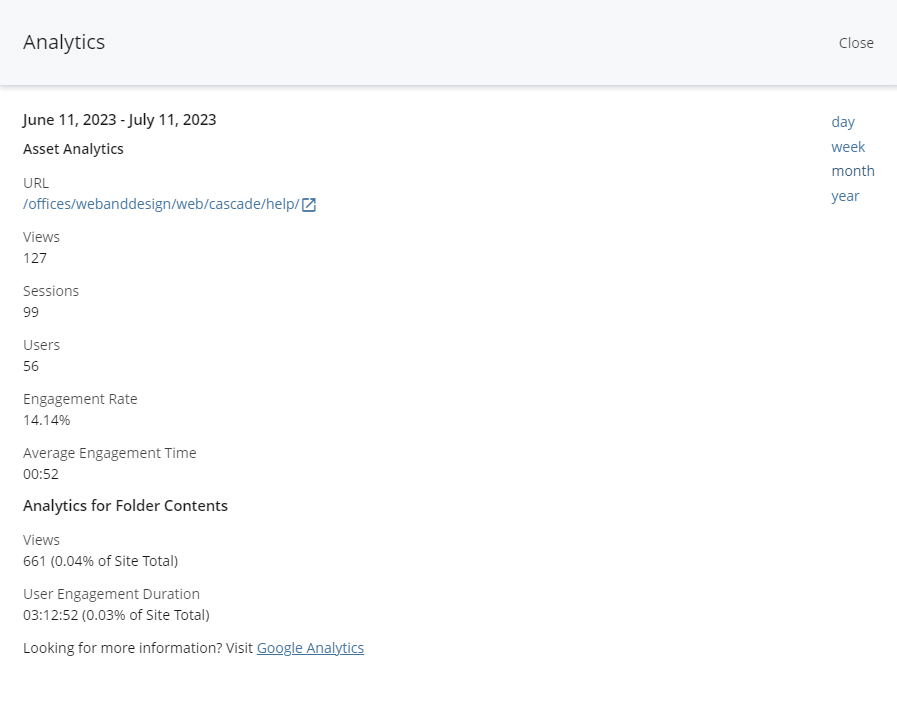
When the Analytics window is viewed for a folder, both Asset Analytics and Analytics for Folder Contents are provided.
Asset Analytics
This is the traffic to the folder's index page and includes the same metrics described above for pages: Views, Sessions, Users, Engagement Rate and Average Engagement Time.
Analytics for Folder Contents
- Views: The total number of times pages in the current folder were viewed. Repeated views of a single page are counted.
- User Engagement Duration: The total length of time that the pages in the folder had focus in a visitor's browser.
A Google Analytics link is provided for the convenience of those editors with Google Analytics permissions.
Google Analytics
Cascade's Analytics feature provides the data a typical user needs on a per-page basis. However, if you need to take a deeper dive into your data, or Cascade Analytics is not available for your school's site, email your Cascade Manager to discuss available options.
Departmental Access for www.wm.edu
If you are interested in access to this data beyond what is available through the Cascade Analytics feature, submit a request. We will provide you with access to an interactive report of the available data — no Google account needed.