


In three words or less, what best describes how you are feeling at this point in the semester?
Date:
October 22, 2020
Audience:
All Students
On October 22, 2020, we asked 613 registered users:
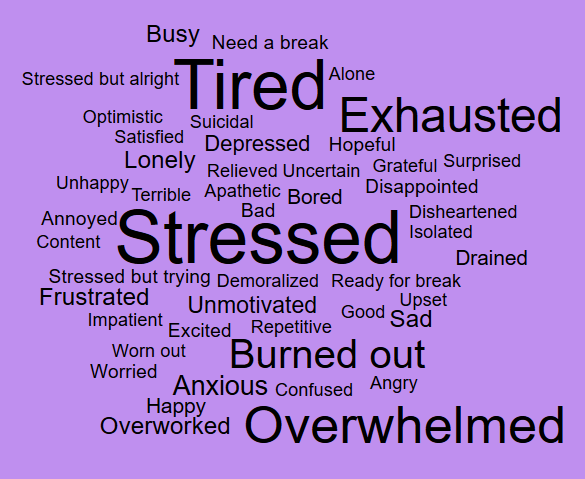
In three words or less, what best describes how you are feeling at this point in the semester?
We received 384 responses (63% response rate) yielding 752 data points (some students responded with three individual words, others with a multi-word phrase). The top three emotions shared were Stressed, Tired, and Overwhelmed.
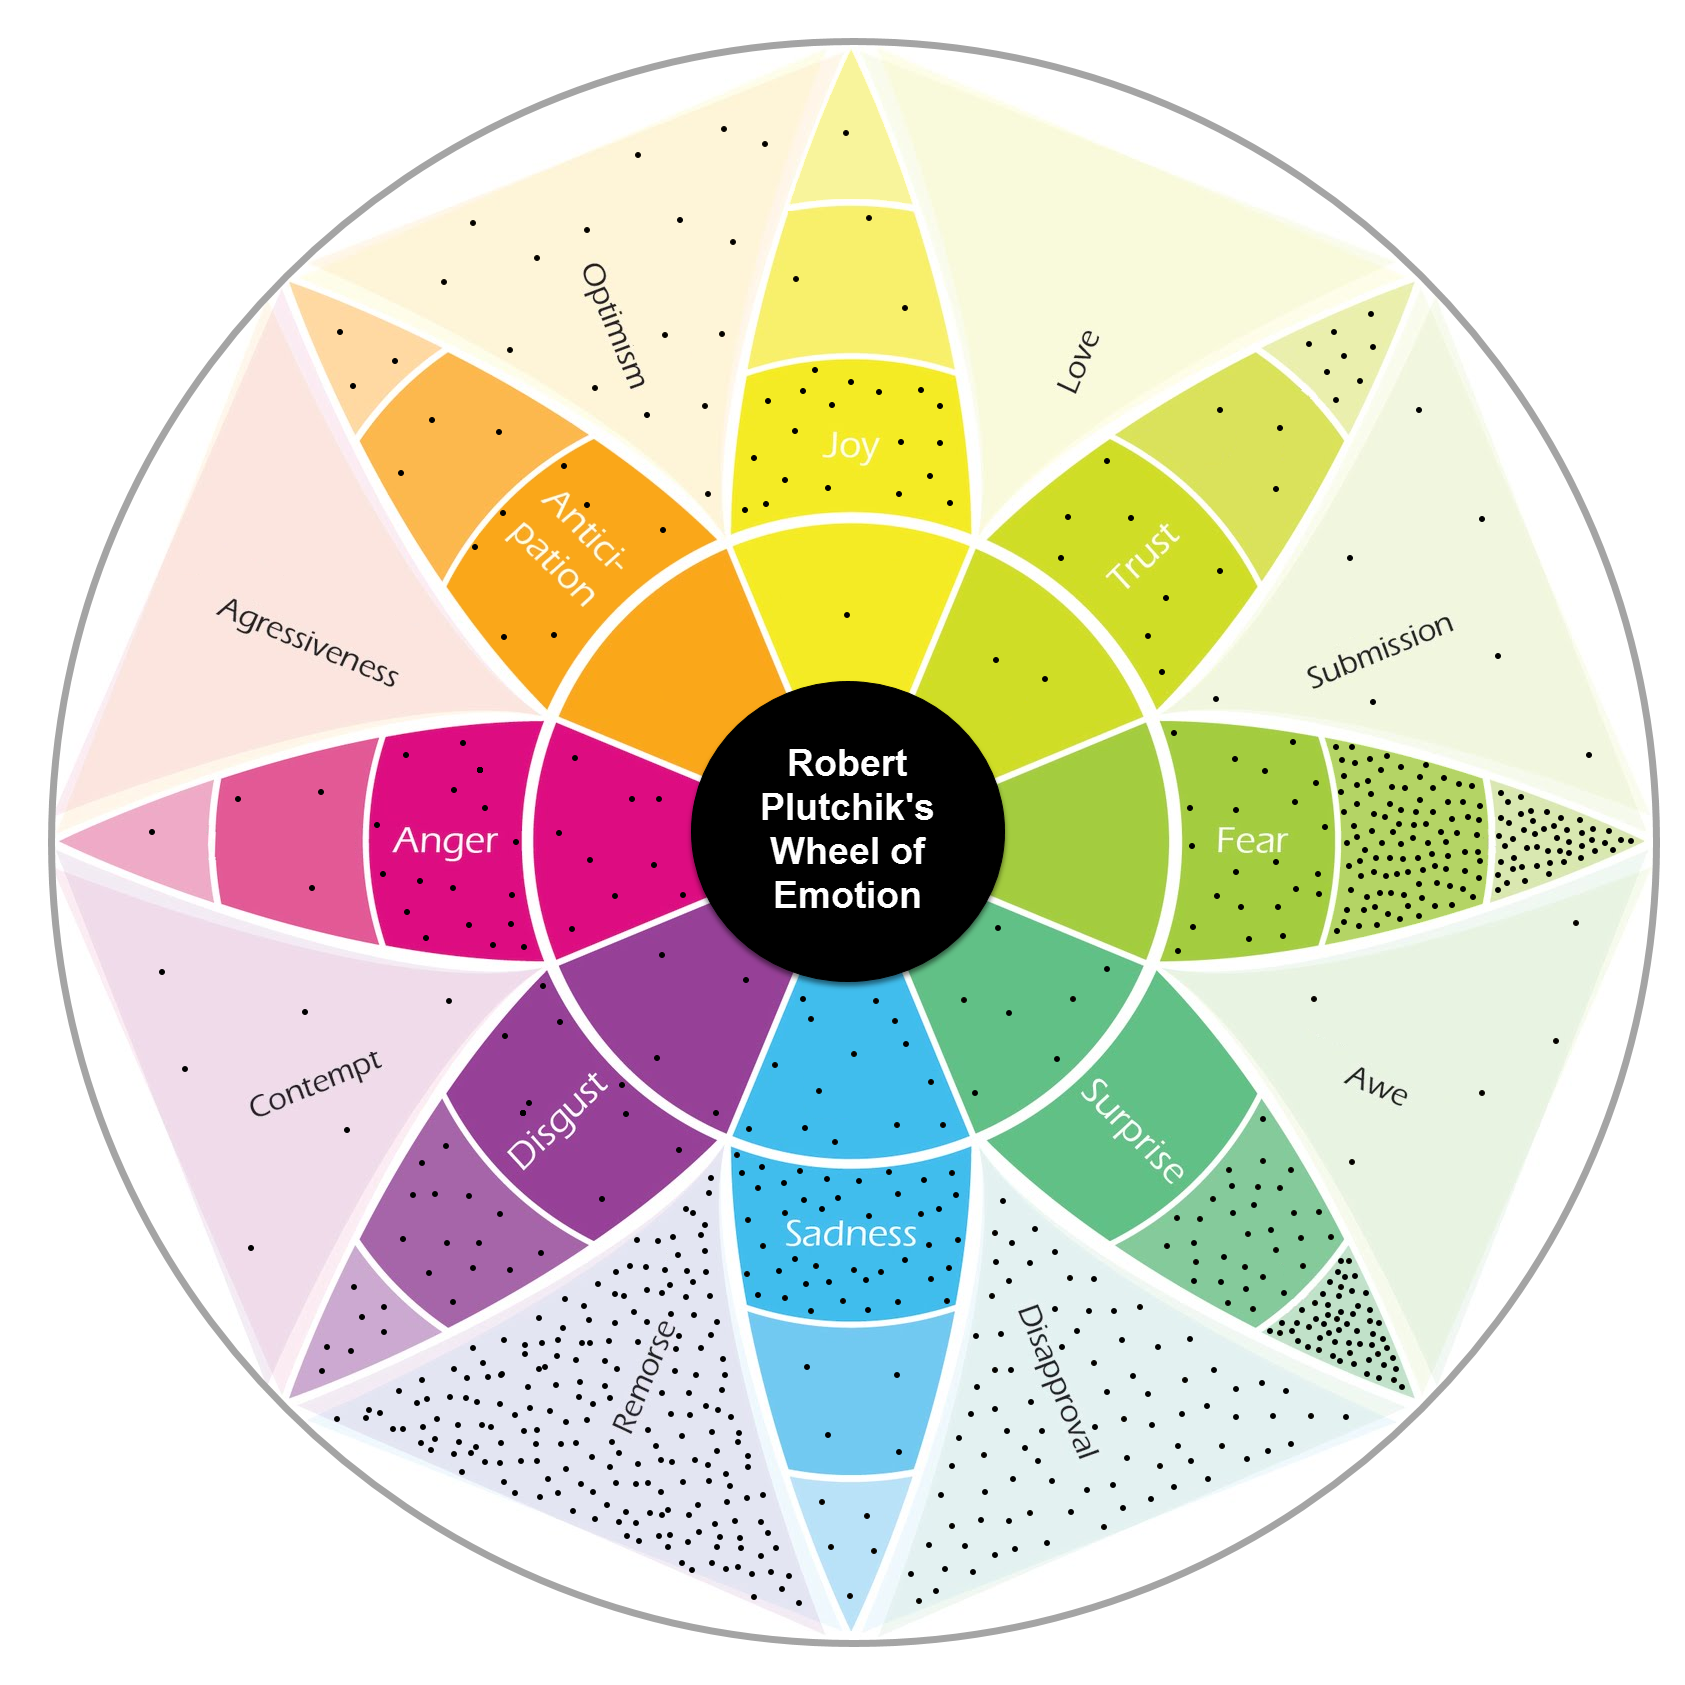
The Climate Group sorted responses according to the Plutchik Wheel of Emotions, one of the models of primary human emotions used in psychology. Each dot represents a response data point, placed to display where it falls in the spectrum of standardized emotional categories. View an interactive version of the data display.
- Anger: 4% of responses and 8% of respondents submitted a word that fell within the Anger category. Of the responses included within Anger, 50% were "frustrated." Others responses included impatient, horrible, and angry.
- Anticipation: 2% of responses and 4% of respondents submitted a word that fell within the Anticipation category. There was no single most common response within the Anticipation category. Some of the responses included trying, engaged, task oriented, and balancing.
- Disgust: 5% of responses and 10% of respondents submitted a word that fell within the Disgust category. Of the responses included within Disgust, 20% were "bored." Additional responses included need a break, disappointed, repetitive, and bad.
- Fear: 22% of responses and 44% of respondents submitted a word that fell within the Fear category. Of the responses included within Fear, 73% were "stressed." Additional responses included worried, anxious, busy, and uncertain.
- Joy: 5% of responses and 10% of respondents submitted a word that fell within the Joy category. Of the responses included within Joy, 25% were "happy." Additional responses included hopeful, relieved, good, and grateful.
- Sadness: 43% of responses and 86% of respondents submitted a word that fell within the Sadness category. Of the responses included within Sadness, 33% were "tired" (reflected within the Remorse section of the wheel due to the parameters of the model). Additional responses included exhausted, burned out, unmotivated, sad, and lonely.
- Surprise: 15% of responses and 32% of respondents submitted a word that fell within the Surprise category. Of the response included within Surprise, 63% were "overwhelmed." Additional responses included excited, ahh, overworked, and confused.
- Trust: 3% of responses and 7% of respondents submitted a word that fell within the Trust category. There was no single most common response within the Trust category. Some of the responses included satisfied, content, comforted, encouraged, and committed.
The Climate Group previously asked this question on August 20, at the beginning of the Fall 2020 semester. Comparing the evolution of student responses:
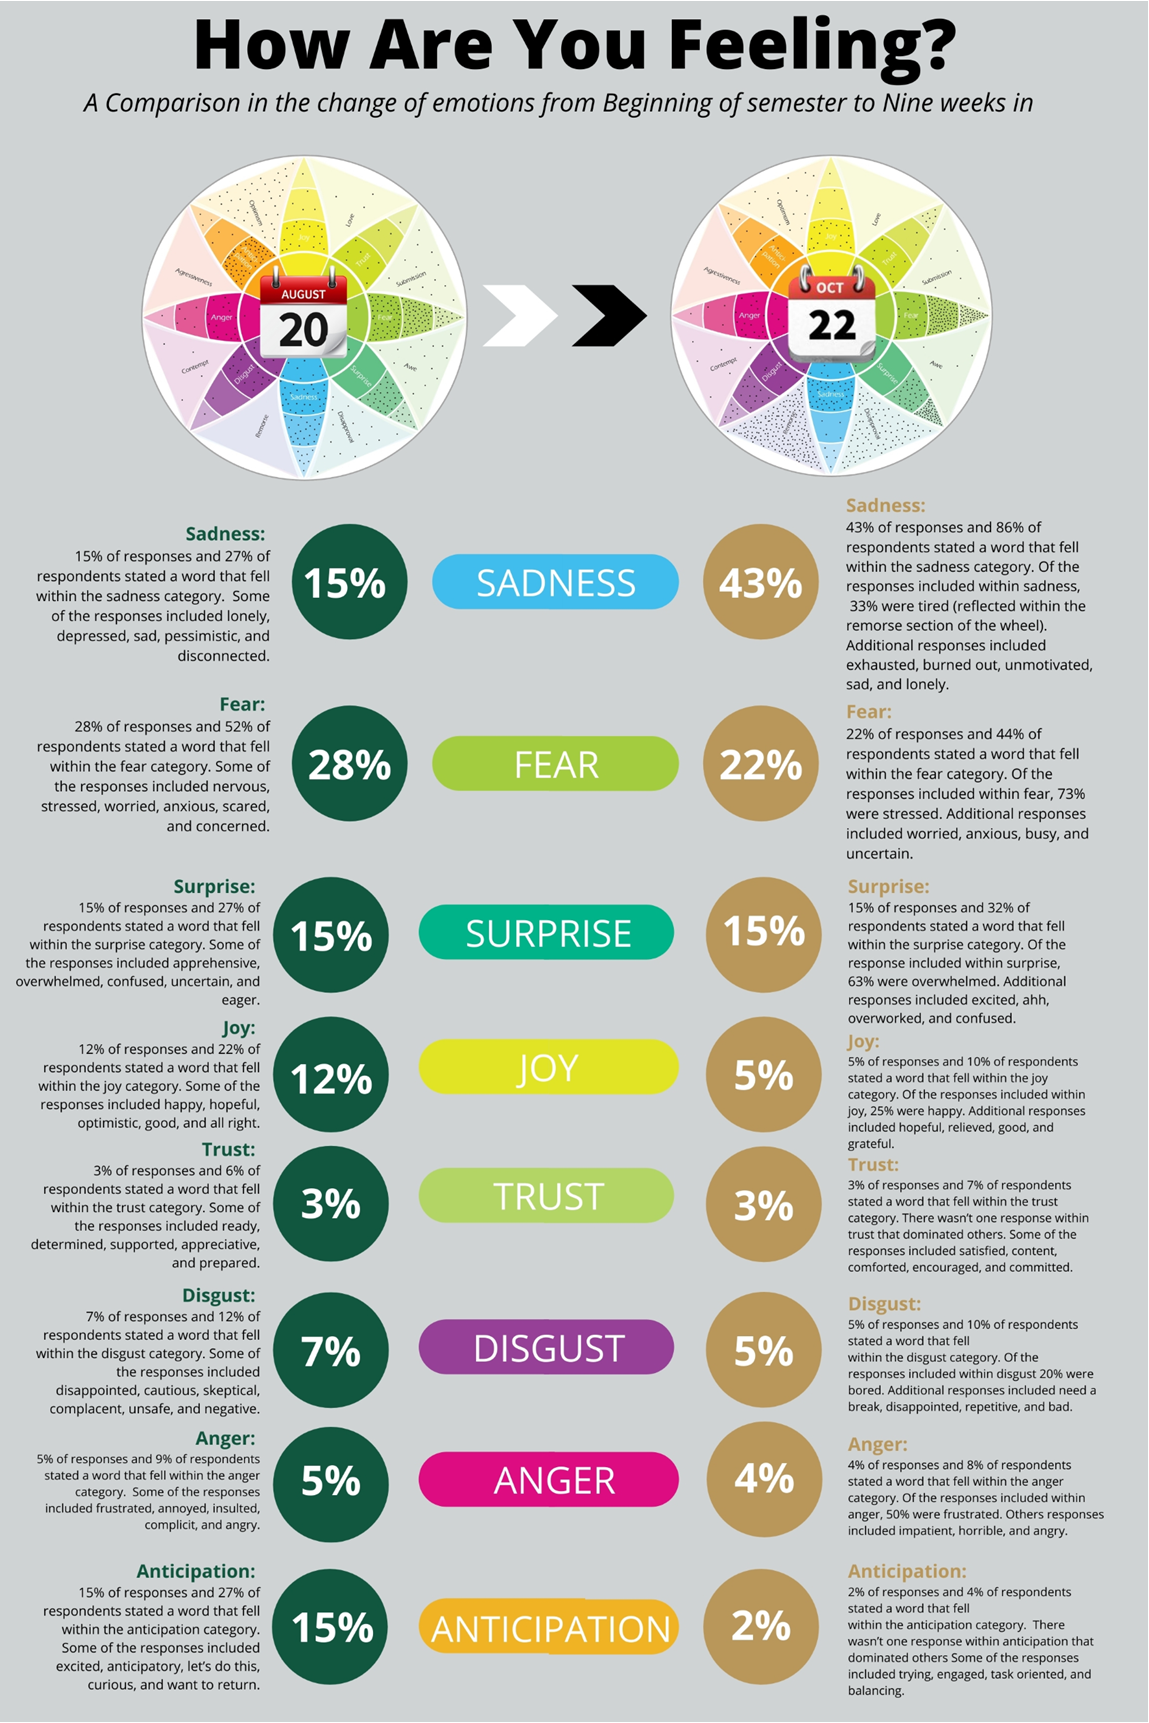
- Anger: 5% of responses and 9% of respondents submitted a word that fell within the Anger category in August, vs. 4% of responses and 8% of respondents in October.
- Anticipation: 15% of responses and 27% of respondents submitted a word that fell within the Anticipation category in August, vs. 2% of responses and 4% of respondents in October.
- Disgust: 7% of responses and 12% of respondents submitted a word that fell within the Disgust category in August, vs. 5% of responses and 10% of respondents in October.
- Fear: 28% of responses and 52% of respondents submitted a word that fell within the Fear category in August, vs. 22% of responses and 44% of respondents in October.
- Joy: 12% of responses and 22% of respondents submitted a word that fell within the Joy category in August, vs. 5% of responses and 10% of respondents in October.
- Sadness: 15% of responses and 27% of respondents submitted a word that fell within the Sadness category in August, vs. 43% of responses and 86% of respondents in October.
- Surprise: 15% of responses and 27% of respondents submitted a word that fell within the Surprise category in August, vs. 15% of responses and 32% of respondents in October.
- Trust: 3% of responses and 6% of respondents submitted a word that fell within the Trust category in August, vs. 3% of responses and 7% of respondents in October.
