


Never mind whirled peas — visualize Virginia’s food-access issues
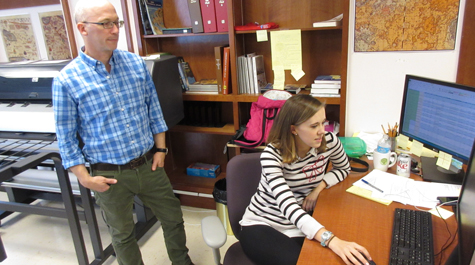 At the CGA: Rob Rose, director of the Center for Geospatial Analysis, looks over the shoulder of CGA Fellow Kaylin Stigall as she walks through a story map on the Virginia Food Access Network website. Stigall, a 2016 graduate of the university, is responsible for much of the graphic visualization that makes the data accessible. Photo by Joseph McClain
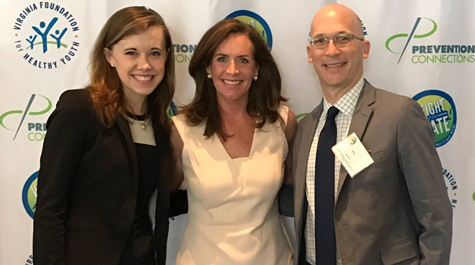 With the First Lady: Kaylin Stigall (left), a Fellow at William & Mary’s Center for Geographic Analysis and CGA Director Rob Rose met with Virginia First Lady Dorothy McAuliffe while working on the Virginia Food Access Network web site. Photo from the Office of the First Lady
Virginia is a prosperous state, yet even so, hunger and food access remain serious issues.
Dorothy McAuliffe, the first lady of the Commonwealth, recently launched the Virginia Food Access Network (VFAN), an interactive tool to address issues of healthy food access throughout the Commonwealth.
“Together, with the Commonwealth Council on Bridging the Nutritional Divide, we have worked to align our efforts to increase healthy food access, eliminate child hunger and accelerate the efforts of dedicated partners from across the state,” said First Lady McAuliffe said in a press release issued at a meeting of the Commonwealth Council on Bridging the Nutritional Divide.
“Through the Virginia Food Access Network, there is now unprecedented access to the data and resources stakeholders need to identify gaps and maximize impact to better serve Virginians struggling with food access and hunger,” she added.
The VFAN website is hosted by the Virginia Cooperative Extension Program. A large part of the site is a set of “story maps” that interface with an interactive map of the commonwealth to provide an easily accessible way to visualize data on food access.
The story maps and interactive maps were developed on the Esri ArcGIS online platform at William & Mary’s Center for Geospatial Analysis. The final result is largely the work of Kaylin Stigall, a 2016 alumna and a CGA Fellow.
Rob Rose, director of the CGA, met with the commonwealth’s chief technology officer and the discussion revealed that a project to take an assortment of data and use it to develop a cogent presentation was something that the Center for Geospatial Analysis does and does well.
“The visualization of spatial data is what we excel at,” Rose said. “If you tell us what you want to show, we can think about how to show that in a map. That’s where the idea of these story maps came from.”
 A story map, Stigall explained, is just like it sounds: a self-contained textual segment that is enriched by online technology.
“Basically, it combines a web map with a narrative,” she said. “Maybe there is some sort of multimedia content — a video or an image. Through this combination, it walks a map user through the issue.”
Stigall explained that a story map is an excellent medium, a format that is able to convey complex data simply to the layman as well as the wonk.
“Not everyone knows how to interact with a webmap,” she said. “It’s not necessarily the most intuitive platform. This story map really structures an experience that is fairly explanatory and easy for people to navigate.”
Stigall explained the elements that make up her Childhood Hunger story map: On the left, there’s a side panel featuring the story title and photo, leading to the text.
“You can scroll through the side panel bar and read the narrative,” she said. “As data becomes relevant to the narrative, you click whatever link is relevant. And you instantly see what the narrative is talking about.”
The main panel is a map of Virginia, with cities and counties outline. “That’s where all the fun stuff happens,” she said. The links in the narrative panel activate layers in the map. Clicking on a link Children who are food insecure (%) turns the Virginia map to a mosaic of magenta shades — the darker the shade, the higher the percentage.
“So say you want to look at child food insecurity in James City County. It’s formatted in the story map so that when you check the link, the layer would appear over that county level,” Stigall explained.
“What’s really cool about the online interactive component is that you get a popup that displays more information,” she added. Additional information adds context, such as the total enrollment numbers in popups related to data on free and subsidized school lunches.
“Because it’s a visual platform, you get the instant satisfaction of clicking on a data layer,” Stigall explained. “Not only can you interact with specific counties very quickly, but because it’s a comprehensive view of all counties at the state level, you can quickly get an idea of trends for specific datasets. Also, the idea that it’s all in the same place is very valuable.”
Rose said Stigall is responsible for much of the site. “We had been working on it for almost a year before Kaylin arrived, but Kaylin really took it to where it is now,” he added. “Most of what you see on the website is Kaylin.”
Stigall said the biggest challenge was figuring out the proper way to present information from 30 data sets to a public audience for whom data-map navigation is more opaque than intuitive.
“So I had to remove myself from the mindset of, ‘Oh, I know exactly what I’m doing. I know how to format this,’” she said. She said she started by asking herself an audience-centric question: “If I have no experience with this type of data, no experience with webmapping, what would be the easiest way of navigating?”
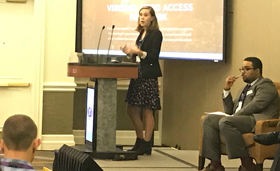
The VFAN web site was presented at a June meeting of the National Governors Association. Rose and Stigall were members of a panel, Collecting and Leveraging Data to Fight Child Hunger. Stigall says the site was received with enthusiasm by a number of teams representing various state administrations.
“I think we inspired several state governments to think more seriously about incorporating geographic visualizations into their outreach and decision-making platforms,” she said.