


'Big data' helps drive big love for actuarial sciences
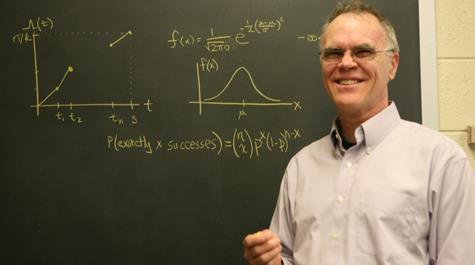 Data-driven: Even in the era of computer-driven big data, Larry Leemis still makes use of the good old chalkboard to explain distributions and other statistical concepts. Photo by Stephen Salpukas
If there is a fire hydrant in front of your home, premiums on your homeowner’s insurance will be lower than the same home without a fire hydrant in its proximity.
But how close should a house be to a fire hydrant to be eligible for a reduced rate? And what reduction is proper? What evidence should be used? The people who figure out the factors that predict how much you should pay for insurance are called actuaries. And William & Mary produces them by the algorithm load.
Using probability, statistics and finance, actuaries drive many of the everyday outcomes of insurance. Drivers who have accidents usually see their car insurance go up dramatically. Smokers usually end up paying more for life insurance. The mathematical predictive power of actuarial science allows insurance companies to keep profitable, steering between the danger of risk on one side and the danger of uncompetitively high rates on the other. Larry Leemis says that all of this may seem intuitive, but the work of actuaries goes much deeper and broader.
Leemis, professor of mathematics at William & Mary, serves as the actuarial advisor in the Department of Mathematics. He has been preparing a record number of students for success in the actuarial science field. To become an actuary, a candidate must pass a series of exams offered by the Society of Actuaries (SOA).
According to Leemis, interest in the math major at William & Mary has more than doubled in the last two decades. He said the increase is due in part to more students wanting to go into fields such as actuarial science. Leemis said he expects interest in the actuarial field to remain strong in the future.
“As you get more people majoring in math and statistics because of the big data push right now, more of those people will be interested in going into actuarial science,” Leemis said.
“Big data” refers to the expanding capability of computational techniques to process amounts of data that were, until recently, unmanageable. William & Mary’s math department is addressing the training, research and educational aspects of big data through EXTREEMS-QED, a program funded by the National Science Foundation. Big data has implications far beyond the actuarial sciences, and Leemis said the effects of the big data movement have become evident in the interests of William & Mary’s math majors.
He said that in the early 2000s, it was typical for three or four William & Mary students to take the SOA’s Exam P, the usual first step on the long path that eventually leads to designation of Fellow of the Society of Actuaries. Today, around ten William & Mary students per year are taking Exam P—and Leemis notes that the W&M pass rate is about double the national average.
Exam P tests candidates on their knowledge of probability and often is attempted by upperclass math majors looking to enter the actuarial field. Leemis explained that the key to success on these exams, and in the profession, is a core of knowledge in probability, statistics, finance and economics.
Exam P (for probability) addresses a variety of topics ranging from probability to financial mathematics to life contingencies. Leemis says the test is a good introduction to the profession.
“To be an actuary you've got to have a good understanding of probability, statistics and money. If you get those three and how they interact, then you've got what it takes to be an actuary,” Leemis said.
As more students have shown interest in taking Exam P, Leemis has compiled unique tools to give students more resources from different angles. Leemis developed a textbook he uses in his probability class that follows the exam syllabus released by the Society of Actuaries for the first exam in the series. However, Leemis’ approach to the material takes on an aspect that provides students with an alternative way of thinking. In the spirit of big data, he employs a computational approach to solving problems.
“You get the analytic solutions—but then I’ll follow that up with Monte Carlo simulation using R, a coding language,” Leemis said.
Leemis explained that one of the best ways for students to grasp a concept is through setting up simulations to better understand the origins of the solutions.
“I look at it as a way to look at analytic solutions in a different light and provide for mathematically intractable solutions,” Leemis said.
One example that benefits from using a computational approach to help students grasp the material is the Monty Hall problem. In the Monty Hall problem, a player on a game show must choose between three doors—one has a car behind it, and the other two have goats. After a player chooses their door, Monty Hall reveals a goat behind one of the two remaining doors, and asks the player whether they would like to stay with their original choice or switch to the remaining door. What’s the smartest choice?
Most people would be surprised to find out that switching results in a 2/3 chance of winning, while staying with their original door only results in a win 1/3 of the time. The correct solution appears to defy common sense and everyone thinks the car-goat situation should be a 50-50 proposition.
Leemis’ Monte Carlo approach allows students to run the Monty Hall numbers. It tests the probability of possible outcomes through a user-defined number of trials. Running the model of the problem coded in R in real time shows possible outcomes and their probabilities.
In the Monty Hall problem, this computational approach shows that the probability of winning when switching doors is 2/3, providing another way to conceptualize the problem. Leemis explained that his simulation technique can also help map out problems that aren’t as straightforward as the Monty Hall problem and students can use to approach to manipulate data and track changes.
Another tool Leemis directs his students to is a univariate distribution chart he created with graduate student Jackie McQueston ’05, M.S. ’07, a utility deemed to significant enough to the profession that it was published in The American Statistician in 2008. This tool charts the deep-rooted connections between key statistical concepts necessary to understanding material on Exam P.
Leemis explained that these concepts are called “distributions.” Just as lawyers must know a wide number of laws in order to do their jobs effectively, actuaries must understand how to use different distributions to tackle complex problems.
Data often form predictive patterns, which mathematicians call distributions. The most familiar distribution is the normal distribution, or the “bell curve.” Different distributions depict different things. Some show the probability of the number of successes of something— one even describes the probability of the distance between birds on a telephone wire. Leemis’ univariate distribution chart demonstrates how these predictors are related, providing users with the proofs that go along with each relation. The chart is a kind of a statistics family tree, a graphic representation in which a user can see, for instance, just how the Inverse Gaussian is connected to the standard Wald, the chi-square and the standard normal.
Another graduate student, Pete Vermeer M.S. ’12, made the tool accessible online and the website has received over 25,000 individual visitors from all over the world and even a few international contributions to the proofs for each distribution.
Leemis is also dedicated to giving students the opportunity to take the exam through his connection with an alumnus, John McCutcheon, who is working in the actuarial field at Geico. McCutcheon provided the funds for 17 students to be able to take the exam.
Leemis credits the success of students to the wide breadth of mathematics courses students must complete to become a math major.
“You need a math major to get through these exams. The stronger course background will lead to your ability to pass,” Leemis said, “Math majors are solid, because the core doesn’t change much. They are ready and prepared to succeed on the exam.”
He explained that the “mathematical maturity” that comes with coursework in many disciplines within math offered here is crucial to understanding the concepts that will come up on the exams and in an actuarial career. However, whether or not a student plans on going into the actuarial field, the coursework in preparation for these exams is beneficial to any math major.
“It’s not just probability in and of itself, it’s where it can take you,” Leemis said, “And it can take you in a lot of different directions.”