


VIMS data shows Irene’s storm tide lower than Isabel and Nor’Ida
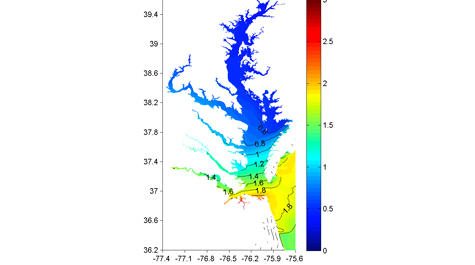 Irene's storm surge Maximum storm surge in Chesapeake Bay as simulated by Professor Harry Wang's computer modeling group at the Virginia Institute of Marine Science. Photos courtesy of Virginia Institute of Marine Science
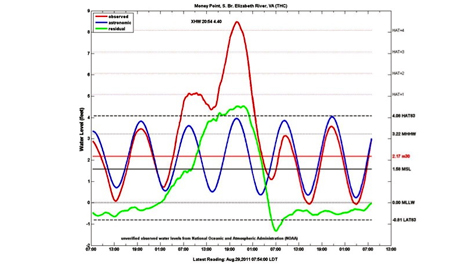 Money Point Tidewatch data for Money Point, Va., during Hurricane Irene, showing observed water levels (red), predicted astronomic tide (blue), and the storm surge (green). Money Point, on the southern branch of the Elizabeth River near Portsmouth, experienced the highest water levels during Irene, at 4.4 feet above highest astronomical tide.
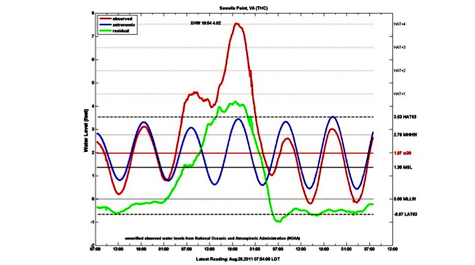 Sewells Point Tidewatch data for Sewells Point during Hurricane Irene, showing observed water levels (red), predicted astronomic tide (blue), and the storm surge (green).
Data from the Tidewatch network developed and operated by VIMS professors John Boon, John Brubaker, and David Forrest show that peak water levels in lower Chesapeake Bay during Hurricane Irene were—with the exception of one tide station—slightly lower than in either Hurricane Isabel (2003) or the “Nor’Ida” storm of November 2009.
The researchers caution that their data are preliminary and may change as they continue their analysis.
Tidewatch measures the difference between predicted tides and observed water levels at 9 locations within Chesapeake Bay—7 water level stations maintained by NOAA's Center for Operational Oceanographic Products and Services and 2 operated by VIMS. This difference—the residual—represents non-tidal, weather-induced change in water level including storm surge.
Tidewatch charts provide an effective way to measure, visualize, and predict the magnitude and impacts of coastal flooding in a given location. The use of Tidewatch charts can help forecasters and coastal residents better prepare for storm tides and minimize their potential impacts. They are particularly useful for comparing storm tides in areas with different tidal ranges.
Preliminary Tidewatch data show that peak water-levels during Irene—measured in feet above highest astronomical tide—ranged from 4.4 feet at Money Point (on the southern branch of the Elizabeth River near Portsmouth) to 2.77 feet at Windmill Point (at the mouth of the Rappahannock River near Kilmarnock). For comparison, peak water levels at Money Point were 4.69 feet during Nor’Ida and 4.26 feet during Hurricane Isabel. Peak water levels during Irene occurred at around 9 pm on Saturday evening August 27th in conjunction with the high tide.
Peak water levels in feet above highest astronomical tide (HAT)* during Hurricane Irene and other storms
| Isabel | Ernesto | Nor'Ida | Irene | |
| Money Point | 4.26 | 1.66 | 4.69 | 4.4 |
| Sewells Point | 4.36 | 2 | 4.21 | 4.02 |
| Jamestown** | no data | no data | 4.16 | 3.31 |
| Back River** | no data | no data | 4.22 | 3.81 |
| CBBT | 3.72 | 1.74 | 3.8 | 3.56 |
| Kiptopeke | 2.74 | 2.04 | 3.12 | 2.72 |
| Yorktown | no data | 2.67 | 3.62 | 3.26 |
| Windmill Point | no data | 3.27 | 2.63 | 2.77 |
| *HAT as determined by preliminary VIMS analysis—use with caution | ||||
| **Water-level data from VIMS Tidewatch network is not yet verified—use with caution | ||||
Computer Modeling
The Tidewatch data accord well with real-time computer simulations of Irene's storm tides generated at VIMS by professor Harry Wang and colleagues. The high-resolution model of Chesapeake Bay storm tides generated by Wang's team showed a 2.2-meter (7.21 foot) maximum rise in water level above mean lower low water (MLLW) at the Chesapeake Bay Bridge Tunnel during the passage of Irene, which compares to an observed rise of 7.38 feet above MLLW at the Bridge Tunnel from the Tidewatch network.
(Tidewatch references storm tides to both MLLW and the highest astronomical tide, or HAT, for a discussion of the differences between these two tidal datums,read John Boon’s explanation.)
The members of Wang's team—professors Jian Shen and David Forrest, marine scientist Mac Sison, and post-doctoral researchers and graduate students Yanqui Meng, Hongzhou Xu, Bo Hong, Chaofeng Tong, Yi-Cheng Teng, Derek Loftis, Qubin Qin, and Zhengui Wang—worked for nearly 72 straight hours during the approach and passage of slow-moving Irene, generating 30-hour forecasts of storm tides in the Bay with a new update every 6 hours.
The six-hour interval between their successive forecasts is governed by the availability of new wind and atmospheric-pressure data from the National Weather Service, NOAA's National Centers for Environmental Prediction, and WeatherFlow Inc.'s Regional Atmospheric Modeling System.
The VIMS model uses these wind and pressure data as input to "force" the model simulation. The amount of data needed to force the model is massive. Even though Wang's team runs their simulations on cutting-edge parallel computing systems at VIMS and the College of William and Mary, each 30-hour simulation averages 30-45 minutes of computer time.
In addition to their modeling of water levels above mean lower low water, Wang's team also conducted an experimental simulation of shoreline flooding for the Greater Hampton Roads area. They are now in the process of comparing this simulation with tidal-gauge measurements recorded by the U.S. Geological Survey.
Public Use of Research Products
Mr. Jeff Orrock, Meteorologist-In-Charge of the National Weather Service office in Wakefield, Virginia, says that model storm-surge runs generated by professor Wang's team at VIMS were highly beneficial.
"We used the simulations continuously as the storm approached, comparing forecast surge levels to the observations and guidance provided by the National Hurricane Center," says Orrock. "The VIMS surge runs increased our confidence in local forecasts, assisting in coordination with local emergency officials and media."
Mr. Lew Grimm, owner of the Deltaville Yachting Center, also praised VIMS' Irene-related research efforts, noting his use of the data provided by the Tidewatch network.
"We not only watched the VIMS' water-level predictions," says Grimm, "we actually sent it out to 2,000 of our customers in a twice-daily storm update."
"Knowledge is power," says Grimm, "and in a situation such as last weekend, you need all the knowledge you can find."
