


Abundance of Chesapeake Bay's underwater grasses increases
An annual survey led by researchers at William & Mary's Virginia Institute of Marine Science shows that the abundance of underwater grasses in Chesapeake Bay increased 24 percent between 2012 and 2013, reversing the downward trend of the previous three years. The increase reflects an upsurge from 48,195 acres to 59,927 acres.
VIMS tracks the abundance of underwater grasses as an indicator of Bay health for the Chesapeake Bay Program, the federal-state partnership established in 1983 to monitor and restore the Bay ecosystem.
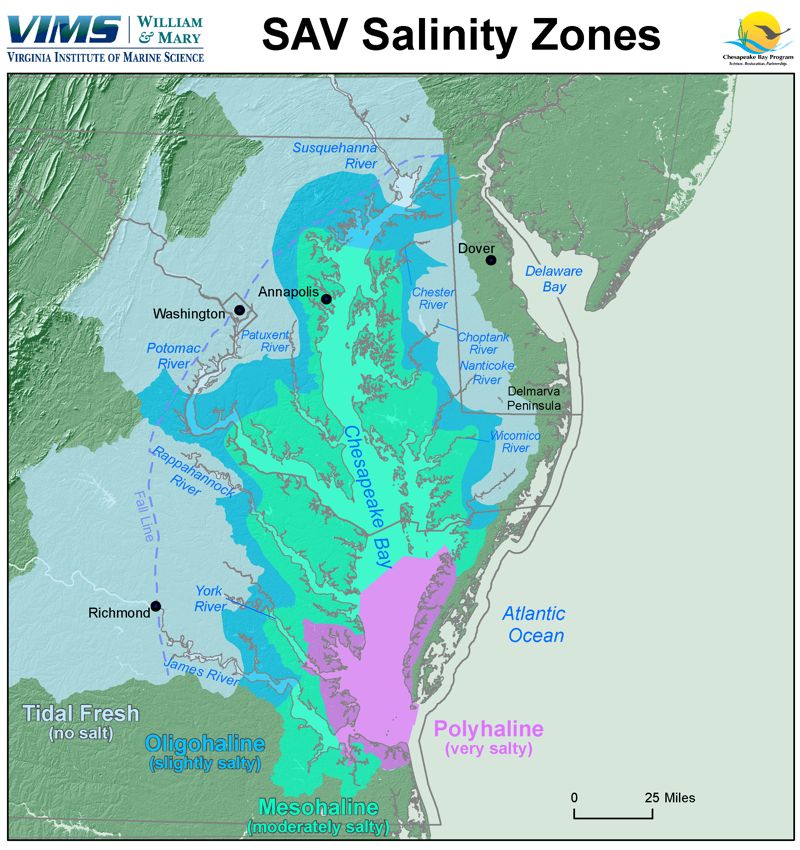
VIMS researchers estimate the annual acreage of underwater Bay grasses through aerial surveys flown from late spring to early fall. This year, the VIMS team for the first time categorized abundance using four different salinity zones, which are home to underwater grass communities that respond differently to storms, drought, and other adverse growing conditions. Reporting grass abundance by salinity zone makes it easier for scientists to connect changes in grass communities with changes in growing conditions through time.
 Scientists attribute this year’s boost in bay-grass abundance to the rapid expansion of widgeongrass in the saltier waters of the mid-Bay, from the Pocomoke Sound to the Honga River south of Cambridge, Maryland. The VIMS team also observed an increase in the acreage of the Susquehanna Flats, and a modest recovery of eelgrass in shallow salty waters, where the hot summers of 2005 and 2010 had led to dramatic diebacks. A lack of sunlight due to algal growth and suspended sediment remains a challenge for eelgrass growth in deeper waters.
Professor Robert “JJ” Orth, head of the Seagrass Monitoring and Restoration Program at VIMS, says “The expansion of widgeongrass in the mid-Bay’s saltier waters was one of the driving factors behind the overall rise in bay-grass abundance. While widgeongrass is a boom-and-bust species—notorious for being incredibly abundant one year and entirely absent the next—its growth is nevertheless great to see.”
The VIMS team began tracking the abundance of underwater bay grasses in 1978, and initially segmented their data by geographic zone due to constraints imposed by then-existing computer technologies.
“We’ve known for many years that reporting by salinity zone would be more ecologically relevant,” says Orth, “but we also knew it would be a massive project to update all our past data into the new scheme.” The decision to do so was made in consultation with the Chesapeake Bay Program’s Submerged Aquatic Vegetation (SAV) Workgroup, with serious discussion of the planned change beginning around 2010.
David Wilcox, a GIS programmer/analyst in the Seagrass program at VIMS, says the switchover from geographic to salinity zones “has been quite a journey.” “This is something that we’ve been working on for four years now,” says Wilcox. “We got the go-ahead to make the change about two years ago, and this year we made the push to get it done.” That push required every available moment, with Wilcox implementing final edits in the last few days before the Chesapeake Bay Program’s release of the 2013 Seagrass Report, fittingly scheduled for Earth Day on April 22.
Lee Karrh, program chief for Living Resource Assessment at Maryland’s Department of Natural Resources and chair of the Chesapeake Bay Program’s SAV Workgroup, says “Since 1984, Chesapeake Bay Program partners have reported abundance of underwater grasses by geographic zone. These artificial boundaries worked for some time, but the switch to mapping grasses by salinity zones makes more ecological sense. Reworking our historic data was hard work, but doing so makes it easier to understand patterns in grass growth.”
Underwater Bay grasses are critical to the Bay ecosystem. They provide habitat and nursery grounds for fish and blue crabs, serve as food for animals such as turtles and waterfowl, clear the water by reducing wave action, absorb excess nutrients, and reduce shoreline erosion. They are also an excellent measure of the Bay's overall condition because their health is closely linked to water quality.
2013 findings in perspective
- Across the entire Chesapeake, bay-grass abundance has fluctuated between 38,958 acres (1984) and 89,659 acres (2002), averaging 65,468 acres. This is 32% of the 185,000-acre Bay restoration goal.
- Bay grass abundance in the Tidal Fresh Salinity Zone (no salt) has ranged from a low of 6,900 acres (1995) to a high of 25,481 acres (2008) averaging 12,399 acres. In 2013, bay grass abundance in this zone measured 13,990, achieving 68 percent of the zone goal, an increase of 1,841 acres over 2012 coverage.
- Bay grass abundance in the Oligohaline Salinity Zone (slightly salty) has ranged from a low of 653 acres (1984) to a high of 13,918 (2005) acres, averaging 6,680 acres. In 2013, bay grass abundance in this zone measured 5,590 acres, achieving 54 percent of the zone goal, an increase of 78 acres over 2012 coverage.
- Bay grass abundance in the Mesohaline Salinity Zone (moderately salty) has ranged from a low of 15,636 acres (1984) to a high of 48,443 (2005), averaging 27,851 acres. In 2013, bay grass abundance in this zone measured 25,579 acres, achieving 21 percent of the zone goal, an increase of 5,958 acres over 2012 coverage.
- Bay grass abundance in the Polyhaline Salinity Zone (very salty) has ranged from a low of 9,959 acres (2006) to a high of 24,015 (1993), averaging 17,887 acres. In 2013, bay grass abundance in this zone measured 14,768 acres, achieving 44 percent of the zone goal, an increase of 3,859 acres over 2012 coverage.
